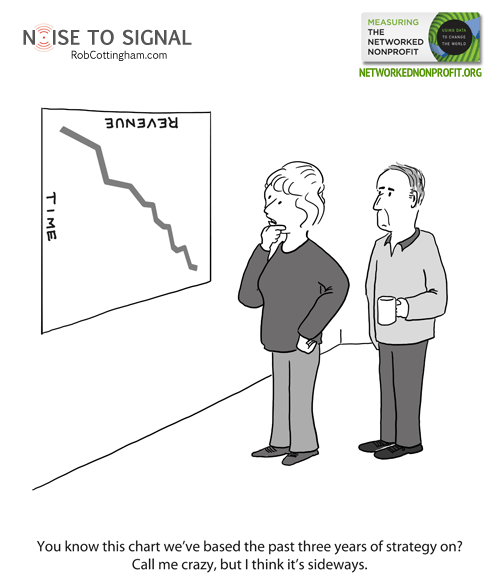
Over the next several days, I’m posting cartoons I drew for Measuring the Networked Nonprofit: Using Data to Change the World, by Beth Kanter and Katie Delahaye Paine. I blogged about the book a while ago on Social Signal, explaining why I love it and why I think you should go buy a copy right now.
~~~
 If you respond to Chapter 3 — “Creating a Data-Informed Culture” — the way I did, you’ll start with short-lived disappointment that it’s not about building a new society whose gold standard of conduct is embodied in Brent Spiner’s character from Star Trek: The Next Generation. (And if you read my write-up for Chapter 2, you’ll realize that cruelly taunting science-fiction fans is a hallmark of Beth and Katie’s writing. You’re also one of two people who reads the write-ups under the cartoons, and as the other one, I thank you.)
That brief let-down is followed immediately by surprise, delight, delighted surprise, actionable insights and, ultimately, firmer biceps — the book is heavier than it looks. You’ll learn the difference between being data-driven, where data dictates your actions, and data-informed, where data is one of the factors that guides you — a happier place for most non-profits. And you’ll see how an incremental approach — crawl, walk, run, fly — can allow an organization to adapt naturally and quickly to the demands and opportunities that measurement presents.

