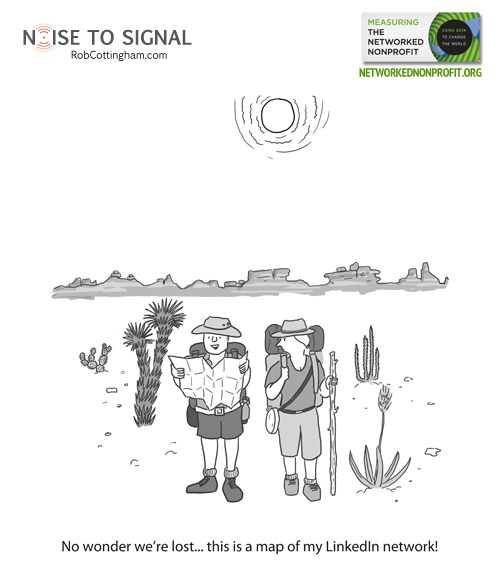
Over the next several days, I’m posting cartoons I drew for Measuring the Networked Nonprofit: Using Data to Change the World, by Beth Kanter and Katie Delahaye Paine. I blogged about the book a while ago on Social Signal, explaining why I love it and why I think you should go buy a copy right now.
↑
N
|
W———•———E
|
S
Chapter 11 is called “Understanding, Visualizing and Improving Networks,” is your introduction to the world of network analysis. That’s a dry-sounding term for a truly juicy topic: mapping and understanding your organization’s network of support and attention.
Why juicy? Because mapping your network takes an abstract concept and makes it visual – and once it’s visual, you can draw sudden, unexpected, profound insights.
For example, thanks to that map of Middle Earth on the opening pages of my copy of The Lord of the Rings trilogy, I knew long before any of the other characters that one really doesn’t simply walk into Mordor. (Also, that a horse-drawn wagon had jacknifed on the Old Forest Road and that drivers should take alternate routes to Mirkwood.)
Possibly more relevant is your ability to see who the hubs and influencers in your network are, and who’s on the periphery – where growth can take off. You can find gaps, identify weak and strong ties, and start measuring the value of your network. You can use something as sophisticated as an Excel plug-in, or as low-tech and analog as sticky notes.
Best of all, you can have a perfectly rational reason to create one of those Carrie-Mathison-style walls-of-clues-and-connections of your own. (Disclaimer: this is insufficient justification for doing this on behalf on your organization. But what you do on your own time is your own business.)

